What can Step2QMS do for you?
Step2QMS, SPC Software is a real-time Data Management & Statistical Analysis solution. Which gives you analysis of all the parts being measured by Quality department at one or more locations. The measurement data or say reports can be from a CMMs, Portable Arms, VMMs, Profile projectors, Height Gauge 2D & 1D, Vernier Calliper. Additionally any other device being used to control the quality of products manufactured in your organization.
Key Features
We will reach out to you with the complete SPC Software Solution
SPC Software Highlights
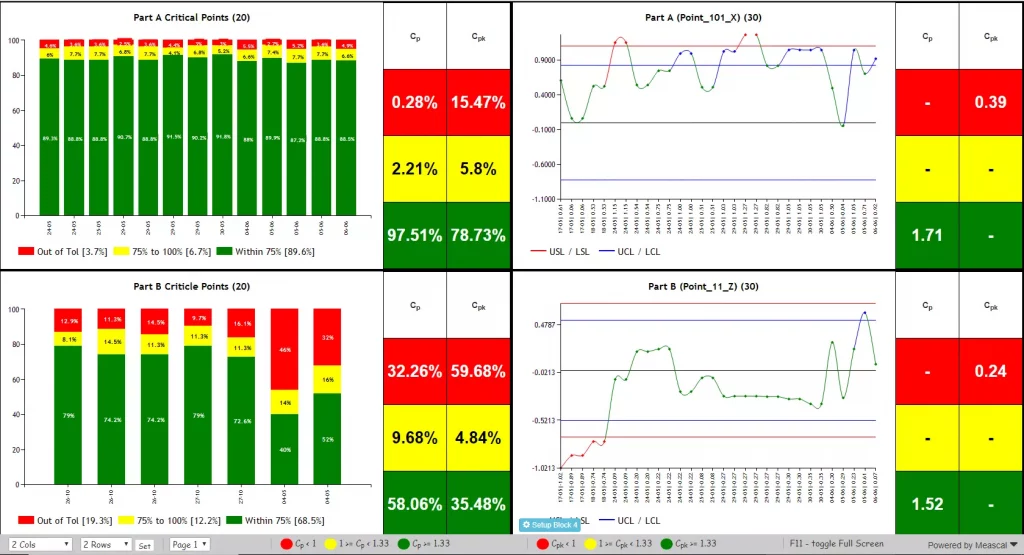
Live Dashboard
A powerful live dashboard to summarize SPC reports on the product’s most critical and quality compromising areas. Highly useful to manage and identify critical error zones with Cp, Cpk & PIST charts, resulting in effective decision-making.
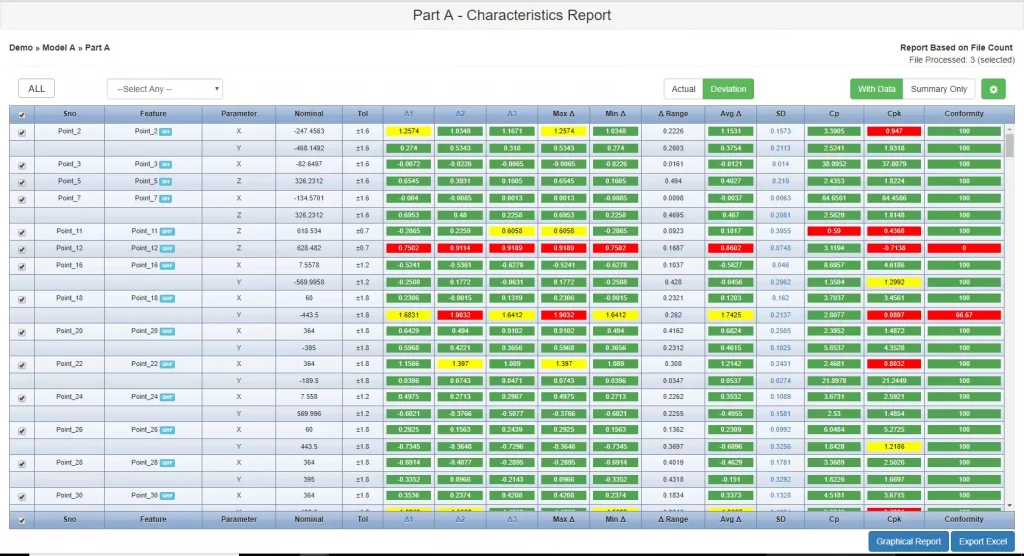
Color-Coded Detailed Reports
Step2QMS offers a detailed carpet chart of all the parameters. with the option to filter the critical dimensions for quick and easy reporting. Reports are color-coded and also have options to export to MS Excel for documentation and presentation purposes.
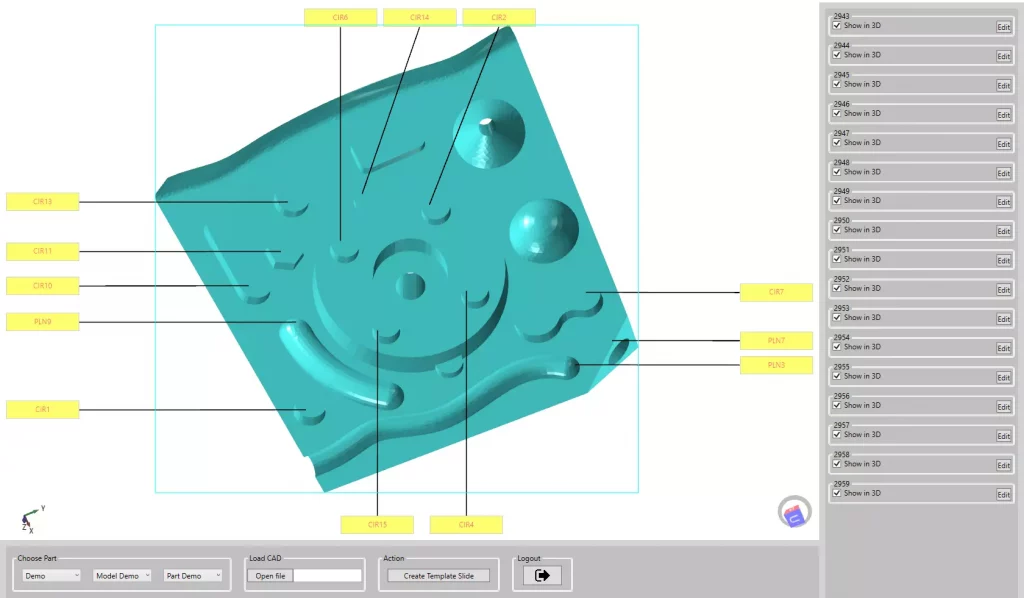
3D Templates from CAD
Creating Templates from the 3D CAD file is the easiest way. Automatically map characteristics on part images for showing flyer positions on exact locations in the reports. Manual marking of point locations is also possible.
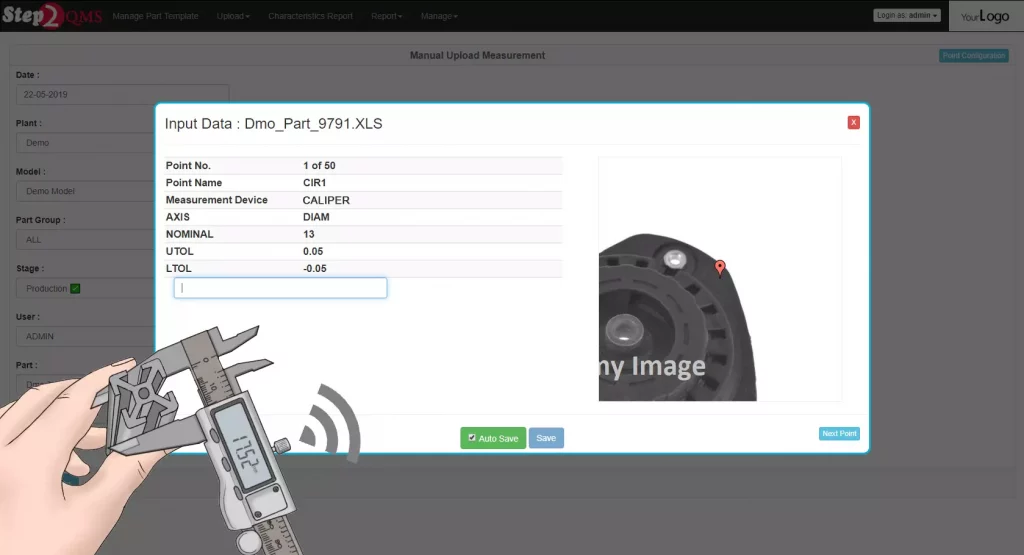
Direct Input From Measurement Devices
Automatically save value & prepare for another input with the click on digital Caliper etc. You can also produce reports in MS Excel and graphical PDF formats for each sample set, along with SPC reports.
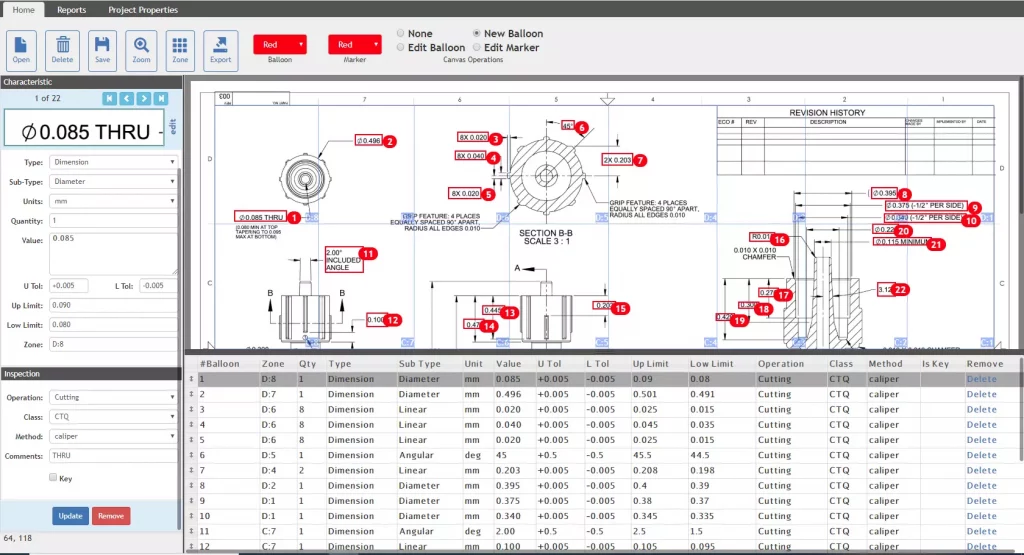
OCR Ballooning
OCR Ballooning is an option to create a control plan. Add a balloon to automatically identify dimensions, along with GD&T specifications with its nominal, tolerances, zone type, etc. It is the fastest and most reliable way to generate FAI.
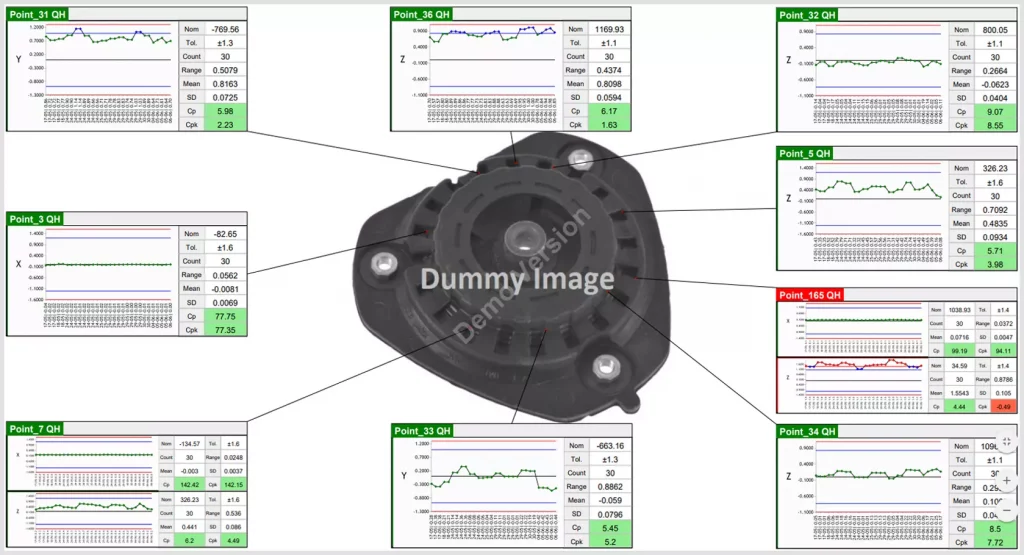
Flyers on Actual Part Image
Flyers connected to the actual point locations on the part image make it easier to understand and evaluate. Various reporting formats including Run chart, X-Bar, R-Bar, Histogram, and Nominal distribution curve along with Cp/Cpk & other information.
Know More about Step2QMS
Charting
- Live dashboard reports.
- Overall model, assembled part, part and characteristics level Cp, Cpk & Conformity graph with user-defined ranges.
- Colour-coded Run chart with UCL/LCL and USL/LSL.
- Deviation chart for user-defined ranges with Run chart and Histogram.
- Pareto charts.
- Six Sigma capability for the Cp, Cpk, distribution curve.
- Stylized, color-coded data points for marked, held, annotated data.
- Control charts X-bar & R-bar.
- Histograms with bell curves.
Reporting
- Characteristic analysis report using Six Sigma methodology with or without moving range deviations.
- Quality check/inspection reports with user-defined data.
- Excel reports with Cp, Cpk, Conformity, deviation in carpet chart.
- Risk analysis for custom ranges.
- Root causes analysis in the assembly part concerning its child parts.
- Report previews are updated automatically.
Calculation and Analysis
- Capability studies with or without moving range deviation.
- Conformity calculation (Point in specified tolerance).
- Change the sub-group size for the control chart (X-bar and R-bar).
- Decimal place definition.
- Estimated or calculated sigma for control limits and process capability calculation.
- Historical analysis or charting on entire data.
- Prompt specific warnings and your custom labels.
Templates and Inputs
- Templates creation from 2D Drawing Ballooning, CAD supported & manual from part images.
- Auto upload data from CMM/VMM exported files.
- Manual upload custom Excel or S/W generated measurement files.
- Direct input from Caliper, Height Gauge, etc. measurement devices.
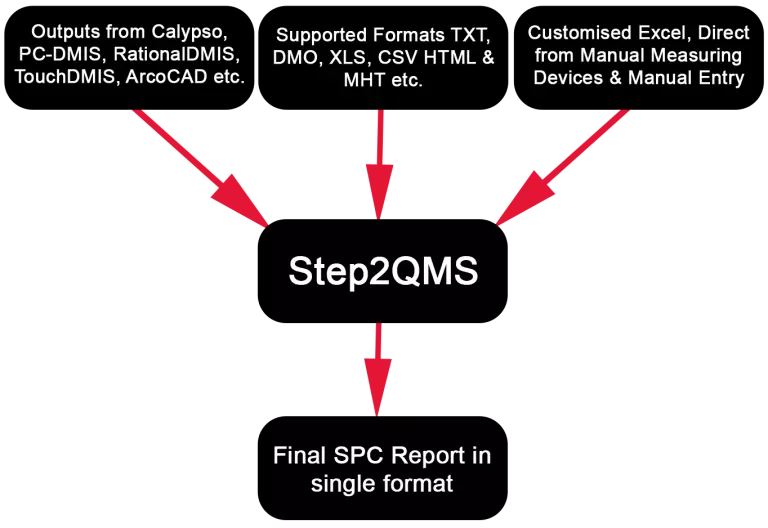
Step2QMS (SPC Software) Working Principle
Step2QMS is statistical process control software which improves product quality, reduces process variation, and optimizes the manufacturing process. Software collects measurement data from multiple nodes like CMM, VMM, Vernier Caliper, etc. Further this SPC software processes this real-time quality data into quality information. Three versions of the software are available, as per variable customer requirements
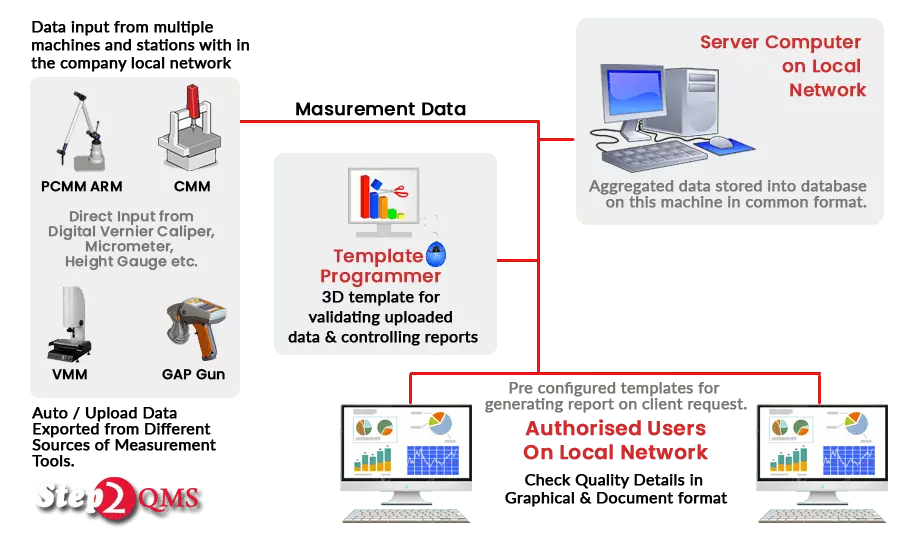
Multi user software version, installed on any server/computer of the network and accessible from entire plant network.
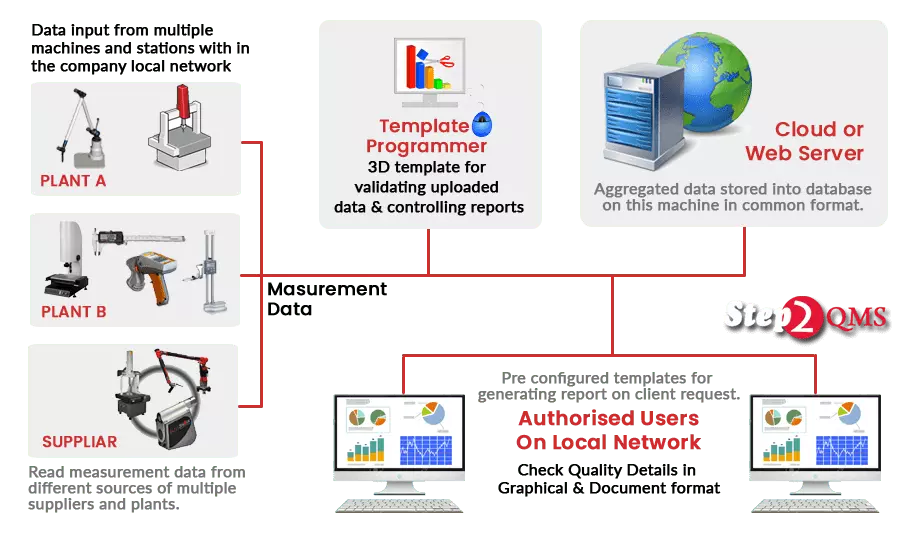
Multi user, multi plant version, installed on the Web/Cloud Server & accessible around the globe by authorized users connected to the internet under multiple plants.
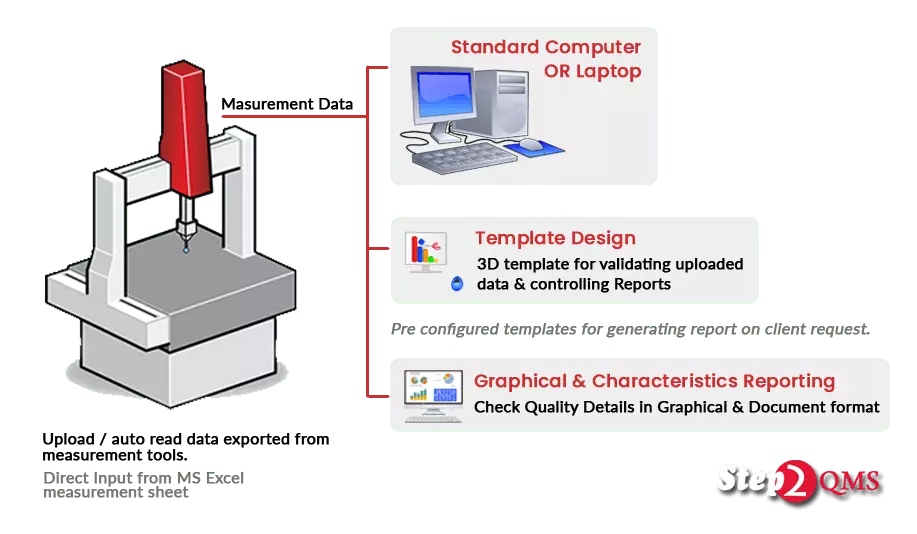
Single user single machine version.
Our Esteemed Clients
- Fiat India Automobiles
- Chasys Automotive
- Praditi Pressparts
- OHSUNG Electronics India
- Mehta Enterprises
- JBM MA Automotive
- GeStamp Automotive
- UMW Dongsin
- Flex Limited
- Indo-MIM
To Know More about this SPC Solution
Fill the form below, we will get back to you to discuss and fulfill your customized SPC requirements. We will provide you the best SPC solution to manage your manufacturing quality data in minimum price.
We also offer on request SPC Software demonstration or trial version installed at you plant.